Analyzing The Correlation Between Bitcoin Reddit Mentions And Price
-
Thu, Feb 6, 2020
-
Sam Smith
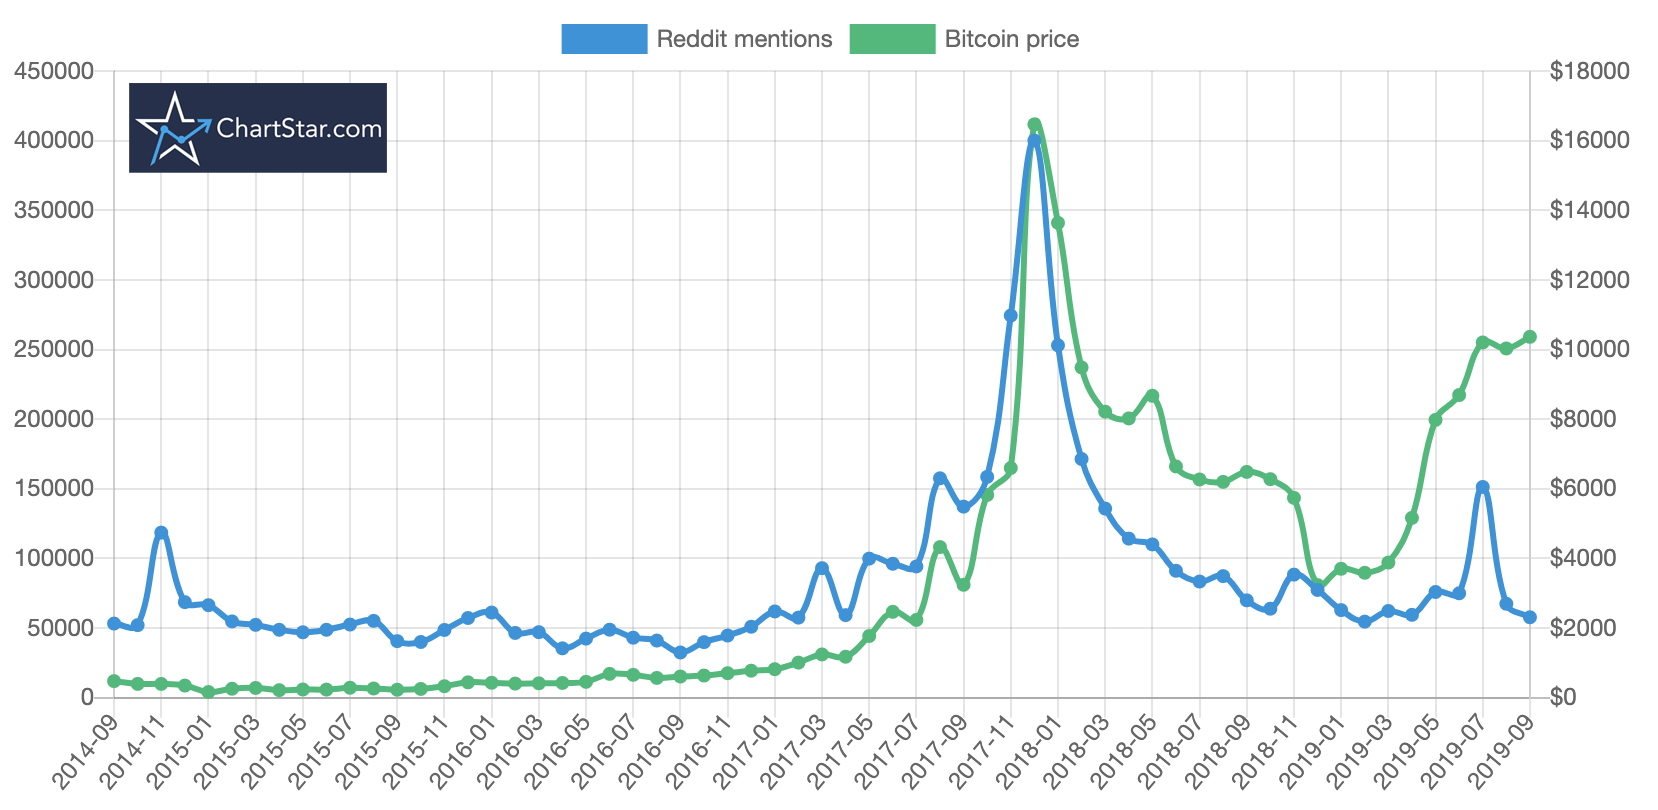
What patterns can we find by looking at the frequency of words in Reddit comments
The above cryptocurrency price chart shows the result of an analysis which plots the frequency of Bitcoin Reddit mentions agains the USD price of Bitcoin over time.
- Is there a correlation between mentions of Bitcoin on Reddit and the price of Bitcoin?
- How strong is the correlation?
- Can we apply this to other coins? For example, is there a correlation between the price of Ethereum and the volume of mentions?
- And perhaps most importantly of all, can we use Bitcoin mentions to predict the future price of Bitcoin and what does the data tell us?
Read on and in this post I'll guide you through the answers, illustrated with some neat cryptocurrency price charts. I will also detail the methodologies used and some avenues for future exploration.
ChartStar offers a free range of advanced cryptocurrency trading tools, orderbook heatmaps and backtesting for testing trends like this, so go ahead and sign up right now!
Counting Bitcoin mentions
The Reddit API provides free, open access to all kinds of user submitted data, including user comments on topics. We'll start by querying all comments ever made on Reddit that contain the word “bitcoin”. My initial thought was that this could require some serious number crunching, as in 2019 alone over 1.9 billion comments were made in total across all of Reddit. Wowser.
My trusty 7 year old iMac anxiously broke out into a heavy sweat as I feverishly cooked up a script to pull down the data I needed from the Reddit API. Given my measly bandwidth and sheer amount of data to process this didn't seem right. There just had to be a smarter way.

Instead it turned out we need to bring in the big guns; introducing…
Google BigQuery, the most badass database ever
Google BigQuery is a cloud-hosted database which doesn't have the limitations of an ordinary database, is as scalable as your budget allows (in my case not much but still) and still allows powerful SQl-like queries to be performed. Just as crucially, in the Google Cloud platform they have a free, publicly available dataset of all the Reddit comments ever made pre-loaded into into a Big Query table. Yay!
It wasn't complete plain sailing from here. The main problem I encountered was how to query the comment data down to granular chunks by month, as there were only raw unix timestamps per comment. Aggregating the data across all time into month chunks posed a problem and just thinking about it was giving me flashbacks to the night before my college math exams

The magic query and a warning
So, just in case anyone else at home wants to play along, here is the magic Google BigQuery query that saves the day:
SELECT STRFTIME_UTC_USEC(created_utc*1000000, '%Y-%m') month, SUM(LOWER(body) CONTAINS 'bitcoin') count
FROM TABLE_QUERY([fh-bigquery:reddit_comments], "LEFT(table_id, 4) BETWEEN '2011' and '2020'")
GROUP BY 1
HAVING month BETWEEN '2011' AND '2020'
ORDER BY 1
Plug this into the BigQuery console, hit run and boom you're done.
One warning though, every Google Cloud account has a free quota of BigQuery allocated to them but once you exceed that you will get billed, and just running the single query above once will push you into the red as it analyzes over a terabyte of data. Note - to any particularly enthusiastic number crunchers who are about to race off with this query, towards the end I find a cheaper (much slower) way to get similar data. Hindsight is 20/20!
Now the fun begins. Bitcoin price charted against Reddit Mentions
Now lets plot the frequency of each mention per month against the dollar price of Bitcoin. I pull the cryptocurrency price data for this analysis from the rather excellent, free CryptoCompare API:

I just want to point out:
- This was the very first attempt at plugging this into the charting software, no adjustments were made. That's quite an impressive visual correlation.
- The monthly price data being plotted is from the mid point of each month
- The BigQuery dataset for Reddit comments only goes up to 2019-09 hence why the analysis stops there
I want to see if we go down to a more granular timeframe for Bitcoin prices what happens to the graph and if we can see a predictive effect.
Bitcoin Reddit comment frequency is somewhat predictive
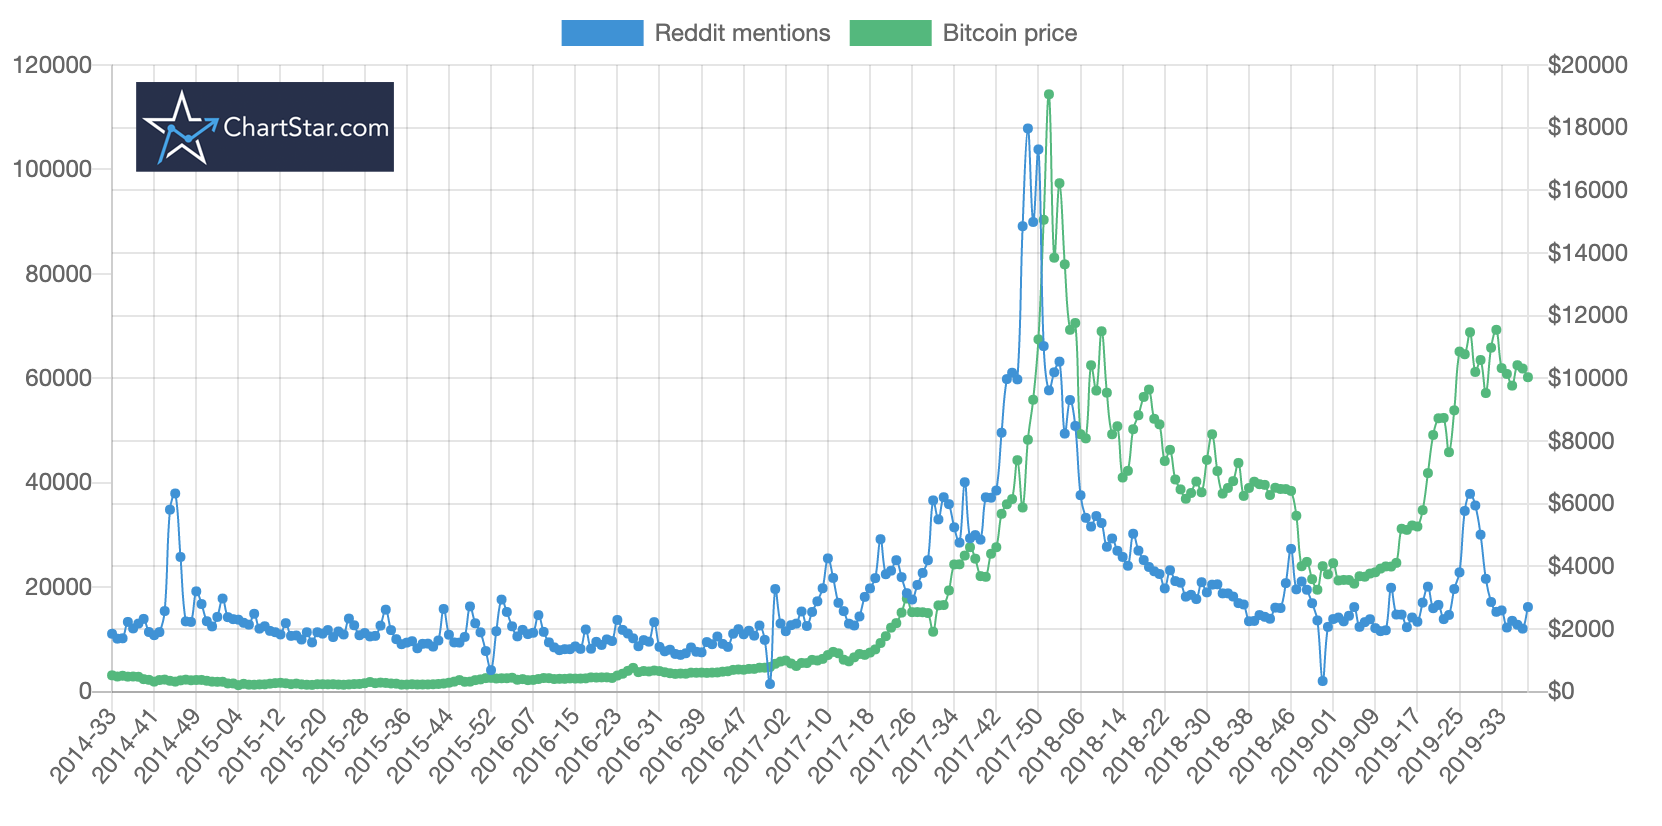
As we can see with the above weekly Bitcoin price chart, several significant price movements are precipated by a noticeable change in Reddit comment frequency:
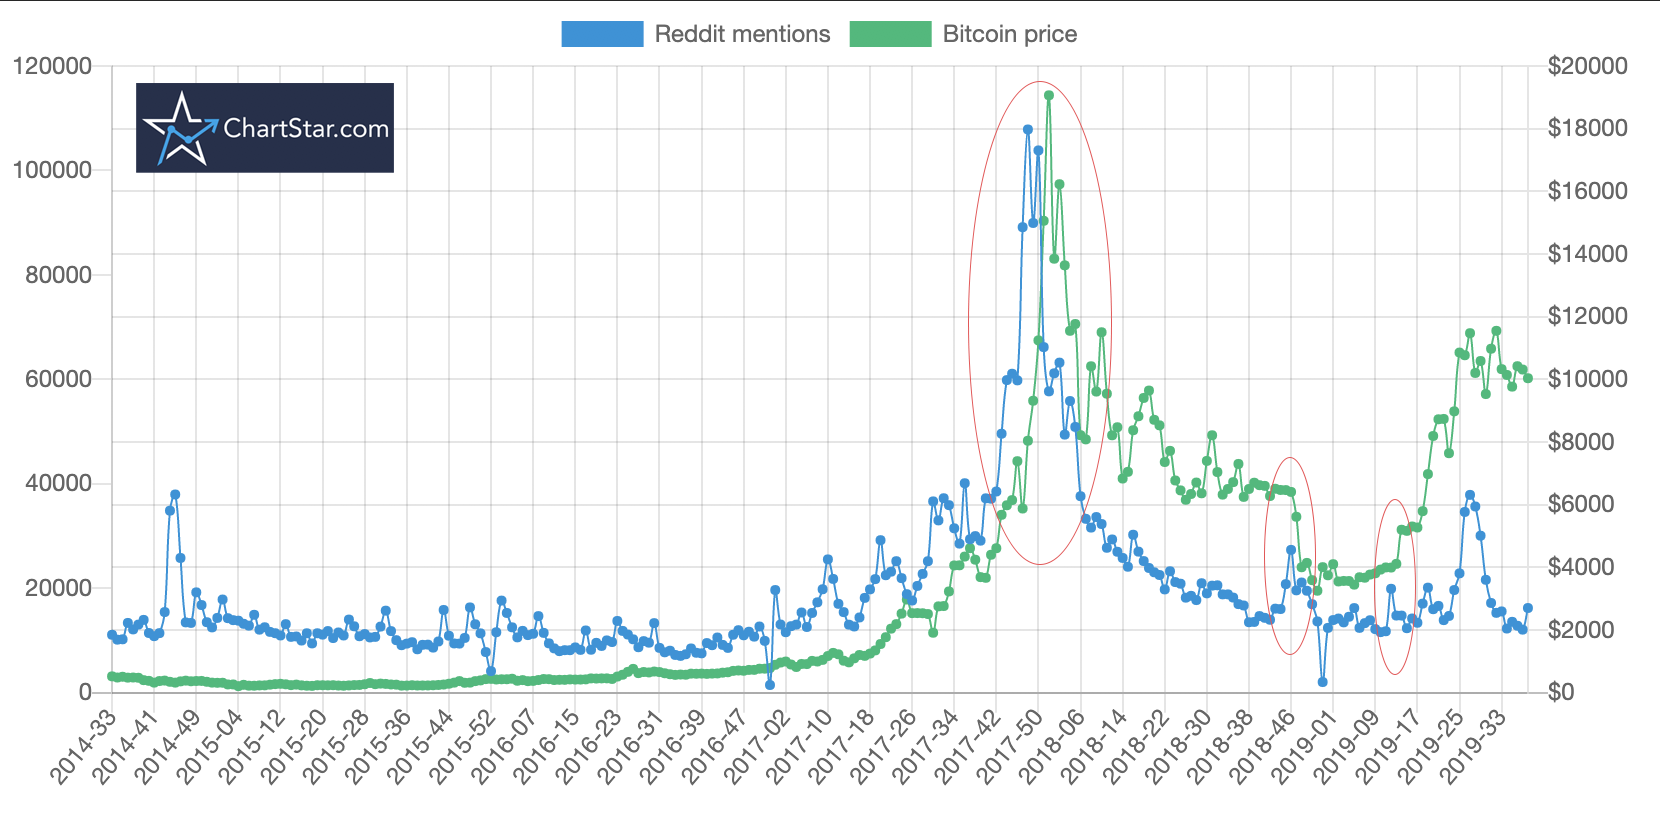
Interestingly, the second circled area shows a spike in comment frequency occured shortly before a decrease in the price. Note the x-axis is of the form year-week.
Mention analysis of other coins
The natural next step is to apply the methodology to other cryptocurrencies. It makes sense to focus on cryptos which have a lot of mentions, so taking a look at the top ranked coins by market capitalization from coinmarketcap we get a few choices:
- Ethereum
- Ripple
- Bitcoin Cash
- Bitcoin SV
- Litecoin
- Tether
- EOS
- Binance Coin
- Cardano
- Tezos
So all we need to do is plug these coins into the magic query and out comes the good stuff.
Except wrong, it's not that simple.
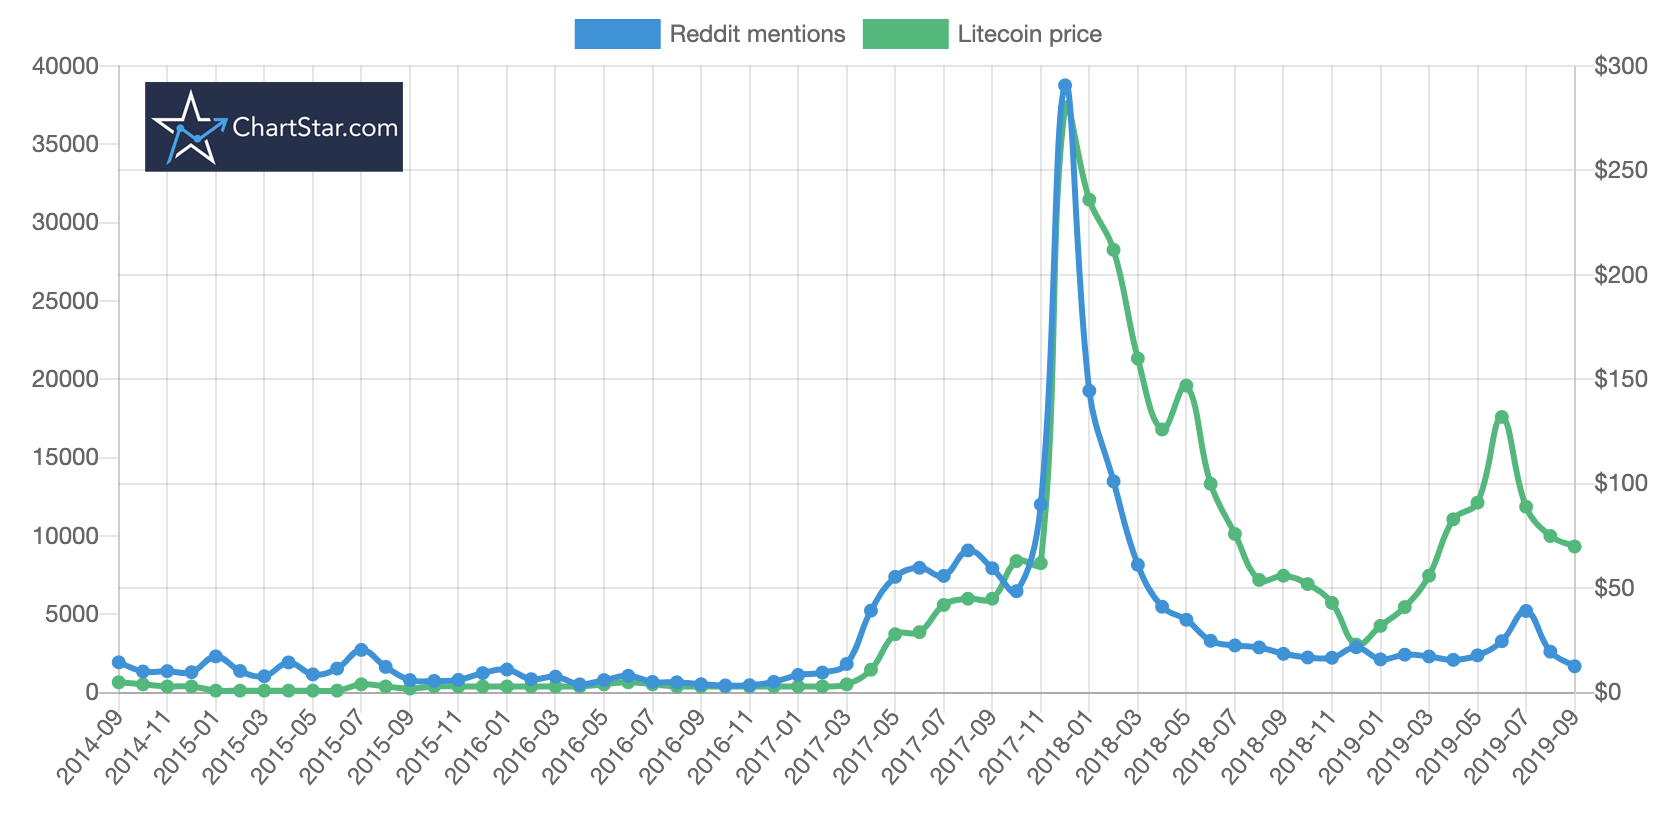
The obvious problem soon becomes, well… obvious. The uniqueness of the word used as the name of the coin is crucial for mention tracking to be effective. We can't track Ripple, as there could be people using the word in a context other than cryptocurrency - “the ripple of the ocean”. Similarly for Tether. There are also some other issues, which I won't go into as this article is already becoming super long. I settled on analysing the following:
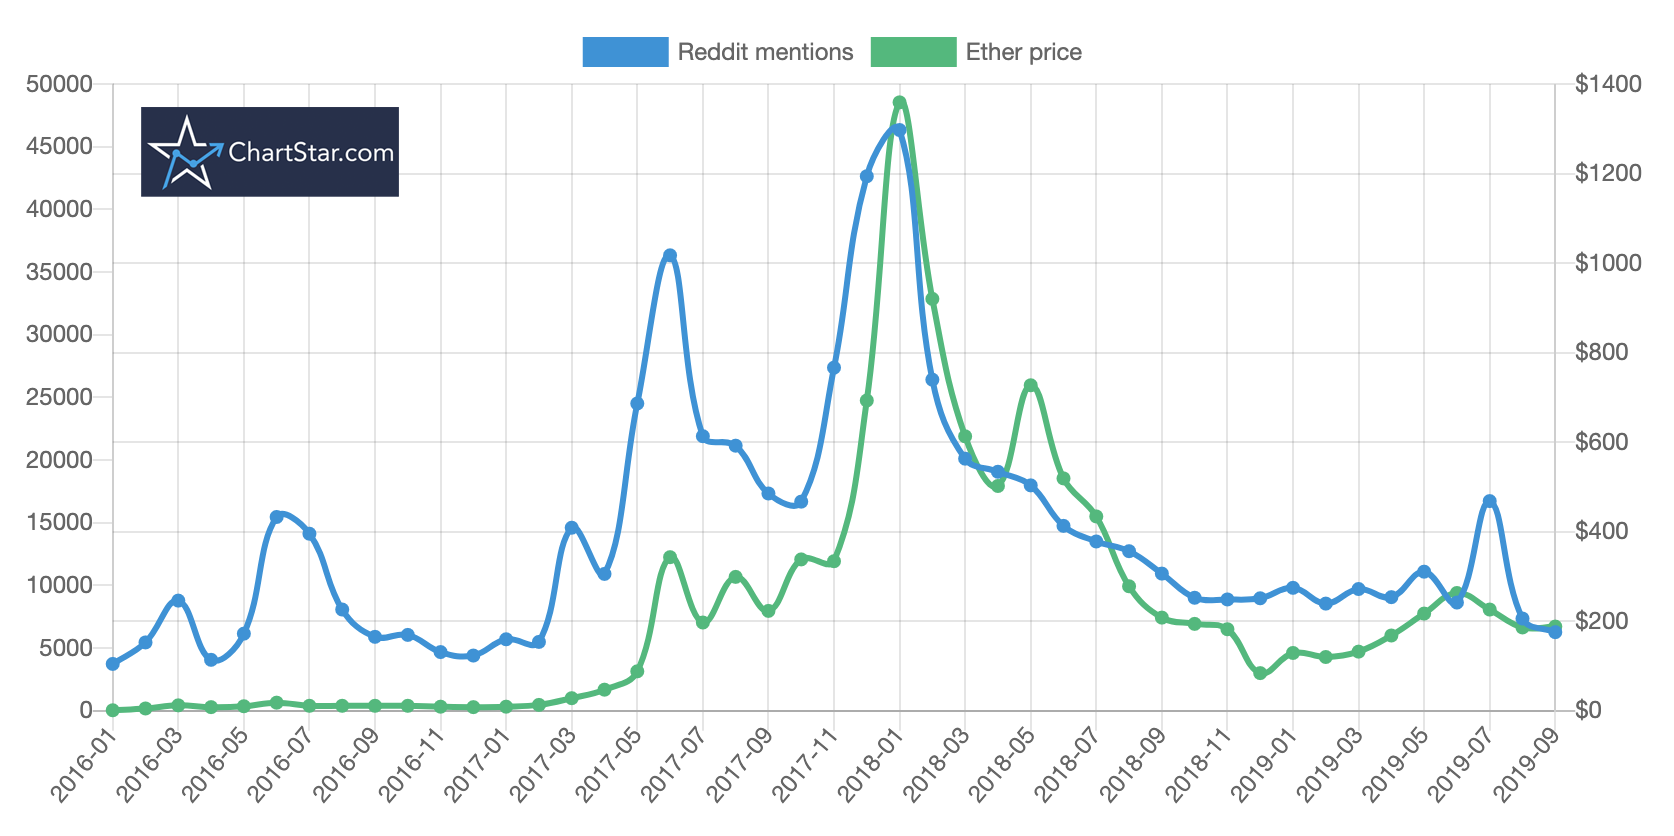
Ethereum price analysis
Litecoin price analysis
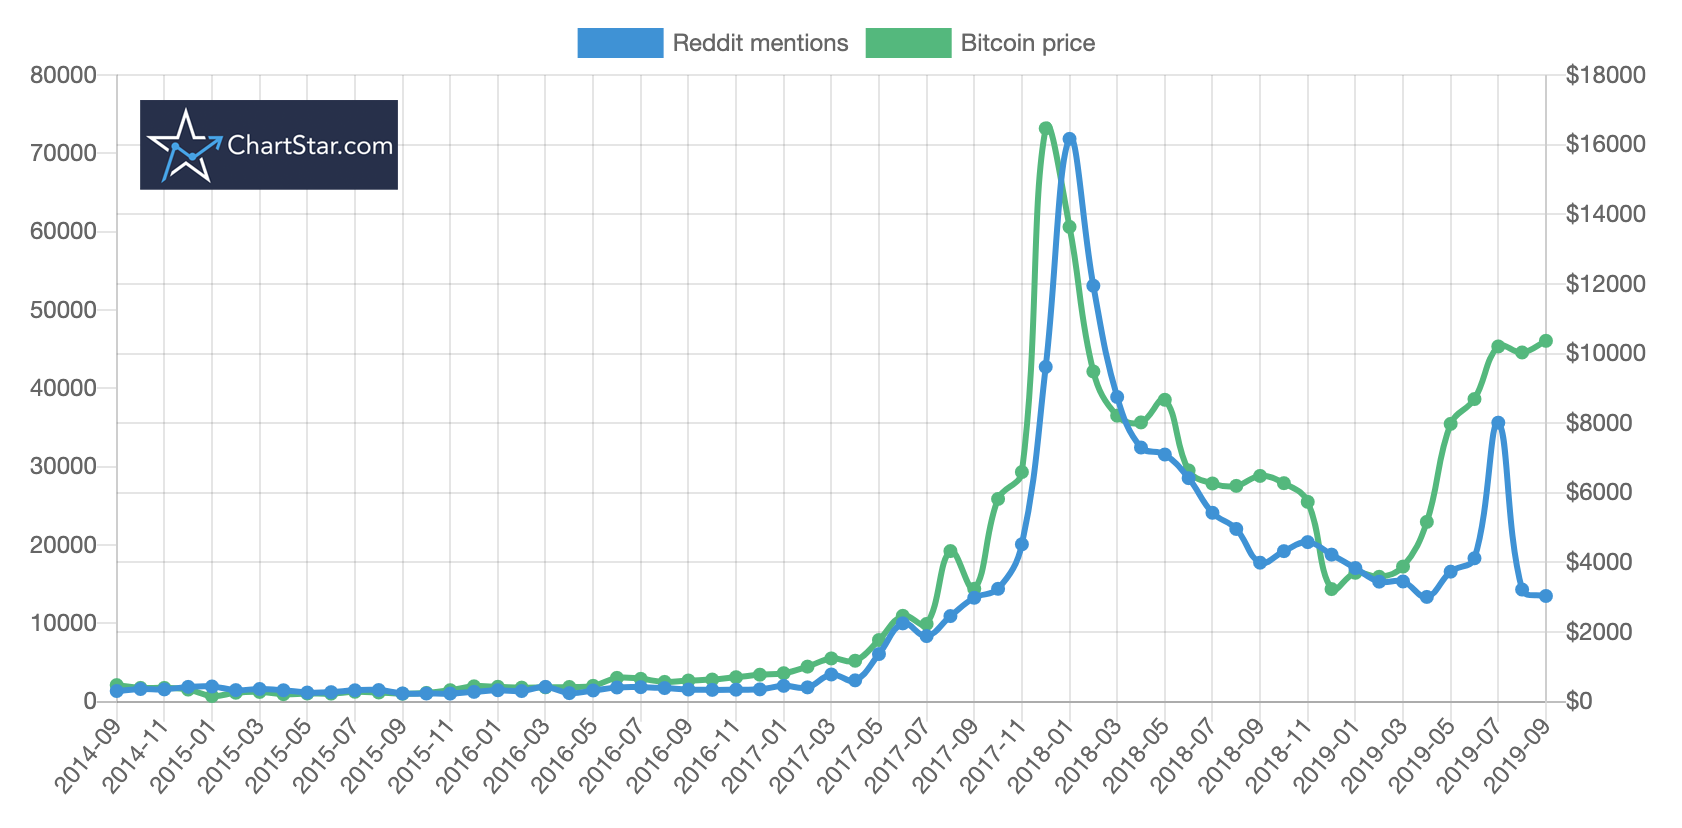
Bonus content - sentiment analysis
This graph shows the frequency of the word “cryptocurrency” vs Bitcoin's price:
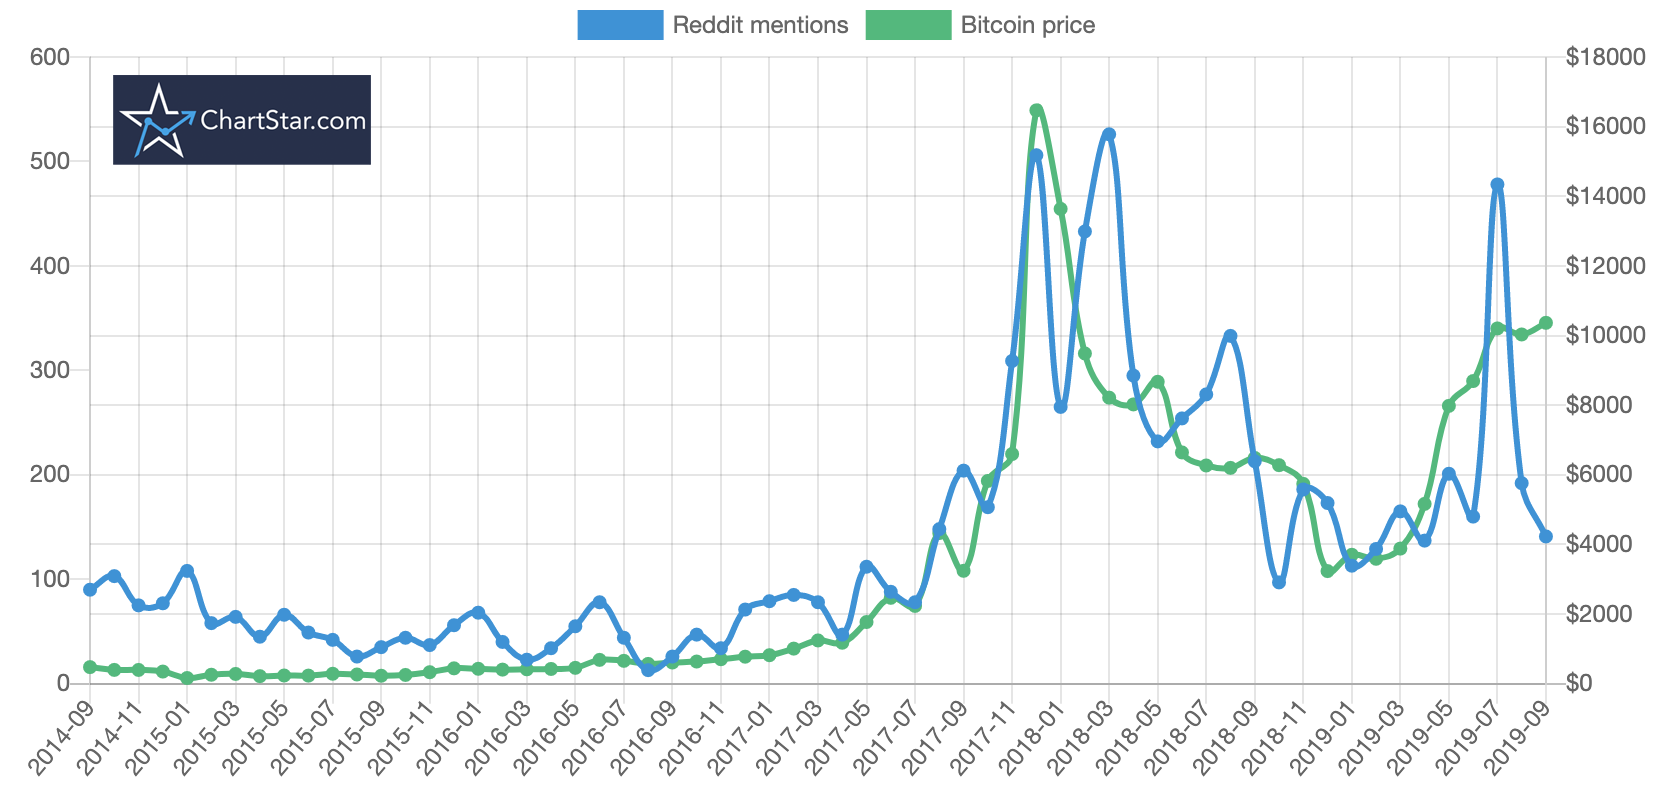
And as a rough form of sentiment analysis, this one focuses solely on mentions of the word bullish within r/bitcoin
Pushshift.io as a cheaper, slower alternative
So it turned out there's a way to do this for free?

So I found out later on that pushshift.io have an amazing source of Reddit data which can be searched for free via their API, including all comments. This could be used to get more up-to-date comment data up until Feb 2020, as the BigQuery data ends around 2019-09. It will be slower though, as you would have to loop through the comments 1,000 at a time and there's billions of them! If there is demand I can put the data I have collated up onto some public Gogle Sheets.
Conclusion
So there we have it, a first look at how comment frequency on Reddit matches up surprisingly well with cryptocurrency prices. Let me know on Twitter if there are other currencies, phrases, subreddits or communities you want me to analyze. As for future directions, more in-depth sentiment analysis could be performed, correlations with on-chain data could be examined, machine learning could be applied to the dataset as well as more advanced SQL queries. I hope you enjoyed the content!
Support
I don't know if you can tell but this one took a looong time for me to put together and research. If you appreciated it subscribing to the blog or retweeting on Twitter would be a massive help. Thanks!
p.s. I have zero Twitter followers at the time of writing so please show me some love!
Analyzing the correlation between Bitcoin Reddit mentions and the price of Bitcoinhttps://t.co/nGtqggmygN
— ChartStarHQ (@ChartStarHQ) February 9, 2020
THREAD...
to get blog posts direct to your inbox
